Peter Brandt Hints at Bullish XRP Pattern With a Coffee Cup Chart

Key Takeaways
- Brandt’s daily XRP chart marks a horizontal level at $1.6572.
- Reaching the marked level from $1.5230 would require an 8.8% rise.
- His earlier $5.40 projection came from a separate monthly chart.
A Coffee Cup Puts XRP’s Gain in Focus
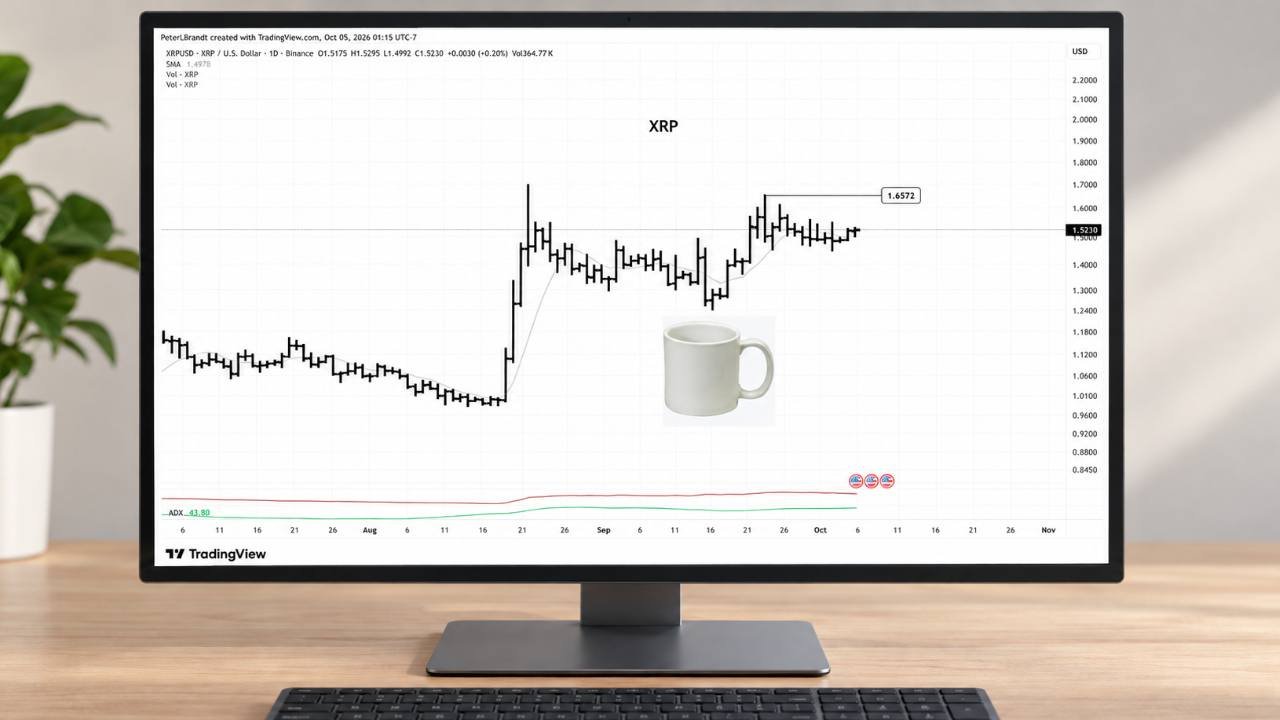
XRP investors have a possible bullish formation to assess after veteran trader Peter Brandt shared a daily price chart on X on Oct. 5. The founder of Factor Trading, a proprietary trading and market research firm, placed a coffee cup beneath the token’s recent trading history, suggesting a potential cup-and-handle interpretation of its recovery and subsequent pullback.
The image shows a sharp August advance, a retreat through mid-September, and a recovery toward a horizontal line labeled $1.6572. Recent bars cluster below that line, with the displayed price at $1.5230. Moving from that reading to the marked level would require an increase of approximately 8.8%, placing the potential resistance test above the latest consolidation.
Brandt’s visual shorthand fits his long-standing use of classical chart patterns to evaluate price movements across financial markets. He entered commodity trading in 1976 and founded Factor Trading in 1980. His approach examines recurring structures in historical prices rather than treating enthusiasm for a cryptocurrency as sufficient evidence of an investment opportunity.
What Would Confirm a Cup-and-Handle Pattern?
A cup-and-handle formation generally combines a rounded price recovery with a smaller pullback near the upper part of that recovery. The rounded portion resembles a cup, while the shorter consolidation forms the handle. In Brandt’s image, the coffee cup suggests that interpretation, while the horizontal line identifies a price level above the recent bars.
The distinction between a developing formation and a completed pattern depends on what happens when price challenges its upper boundary. Fidelity describes cup-and-handle confirmation as a breakout above both sides of the cup. Its technical analysis presentation also notes that prices often return toward the breakout area afterward, a movement known as a throwback.
Different chart intervals can reveal different structures, even when they track the same asset over overlapping periods of trading. Candlesticks, resistance levels, and time frames help describe those distinctions. The daily view in the Oct. 5 image emphasizes recent price behavior, whereas a monthly chart compresses years of trading into a longer-term perspective.
Brandt’s Earlier XRP Forecast Adds a Longer View
The latest image follows Brandt’s separate long-term XRP projection of $5.40 on Sept. 21. That monthly chart accompanied his statement: “This is my long-term chart of $XRP. It implies an eventual advance to $5.40.” XRP traded near $1.54 then, making the projected level approximately 251% higher than the contemporaneous price.
His subsequent comments tied that interest to price history while challenging the unquestioning loyalty of some XRP supporters. In a Sept. 26 X post describing his chart-based reason to consider XRP, Brandt wrote: “The charts alone have always been enough reason for us to make a bet.” That assessment concerns his trading framework, distinct from the latest daily formation.
Institutional interest provides another perspective on XRP, with asset manager Bitwise’s investment chief emphasizing its history and familiar financial applications. Matt Hougan discussed XRP’s appeal to financial advisers in a video Token Relations shared Sept. 28. He pointed to cross-currency transfers and liquidity, the availability of assets needed to transact, as recognizable financial functions.